You own more NVIDIA than you think
Three funds, one hidden concentration. The X-Ray unpacks every fund you hold into the companies underneath and adds up what you really own.
Free forever. No card, and no AI key required to look around.
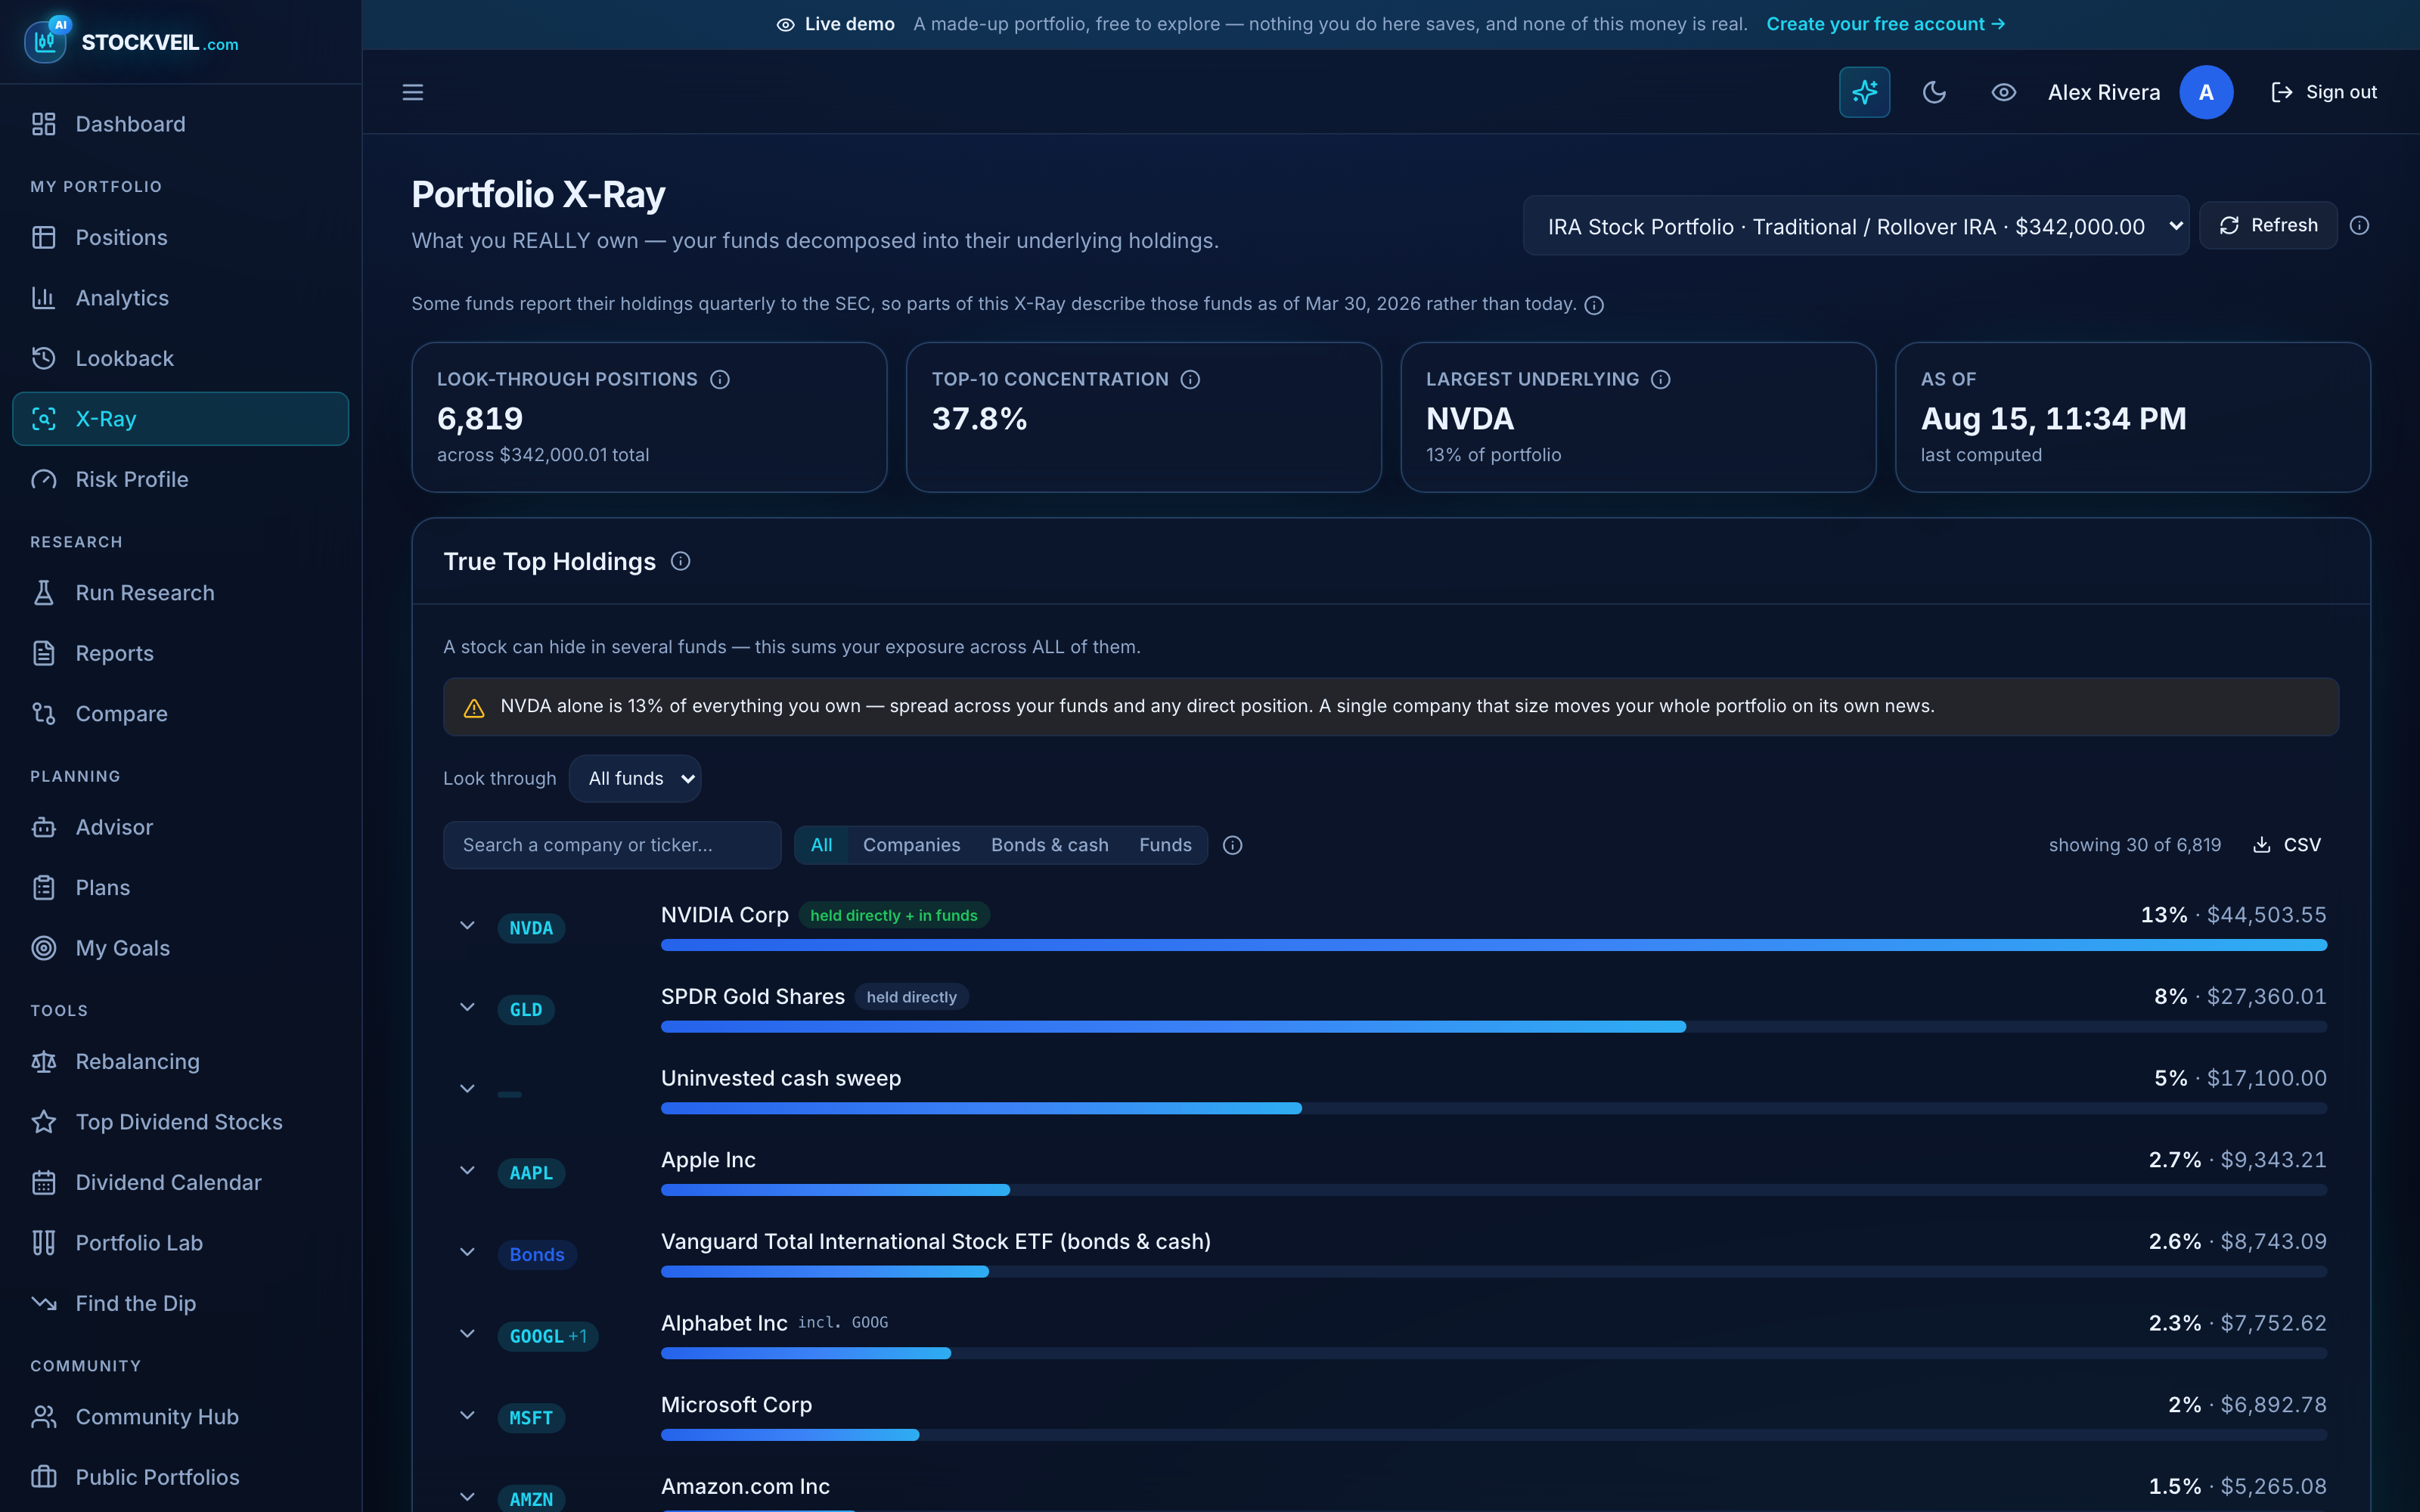
What does the X-Ray actually show?
Your real exposure to each company, summed across every fund that holds it plus anything you hold directly. A total-market fund, a Nasdaq fund and a few shares of one company can quietly add up to a sixth of your portfolio riding on a single name.
- True top holdings, with the funds contributing each one
- Pairwise fund overlap — which of your funds are the same fund
- Look-through sector exposure across the whole portfolio
- Share classes merged by CUSIP issuer, so GOOG and GOOGL count once
Where does the fund data come from?
From the funds’ own SEC filings — the primary source that data vendors resell. Every fund registered in the US files a full list of its holdings quarterly, and Stockveil reads it directly.
- Complete constituent lists, not a top-25 sample
- Each fund shows its source and the date it describes
- Covers workplace mutual funds that ETF-only vendors skip
How current is it?
Filings are quarter-end with a lag of up to about 60 days, so the page tells you the oldest filing in play rather than implying everything is from this morning. A fund whose data is three months old says so.
Is high concentration bad?
Not automatically, and we try not to be alarmist about it — a plain S&P 500 fund is around a third in its top ten and that is normal. What matters is knowing, especially when the concentration comes from funds you thought were diversifying you.
Keep looking
Portfolio tracking
Brokerage, IRA, 401(k), savings — including the ones no app can sync. One total that is actually your total.
AI research
Every report is scored by four opposed investing philosophies, then argued over by a bull and a bear. You bring the AI key; we make sure the numbers are ours.
Projections
What your portfolio could be worth in 1 to 30 years, built by replaying real market history — and labelled a simulation, because that is what it is.
Tools
Where should this month’s deposit go? Would that allocation have survived 2008? When does the dividend actually land?
Ready to see your own portfolio this way?
Connect an account, import a statement, or just open the demo and click around first.