Everything you need to understand what you own
Track it, see inside it, score it, and project it — with the working shown at every step.
A fully populated demo account — no signup, no card.
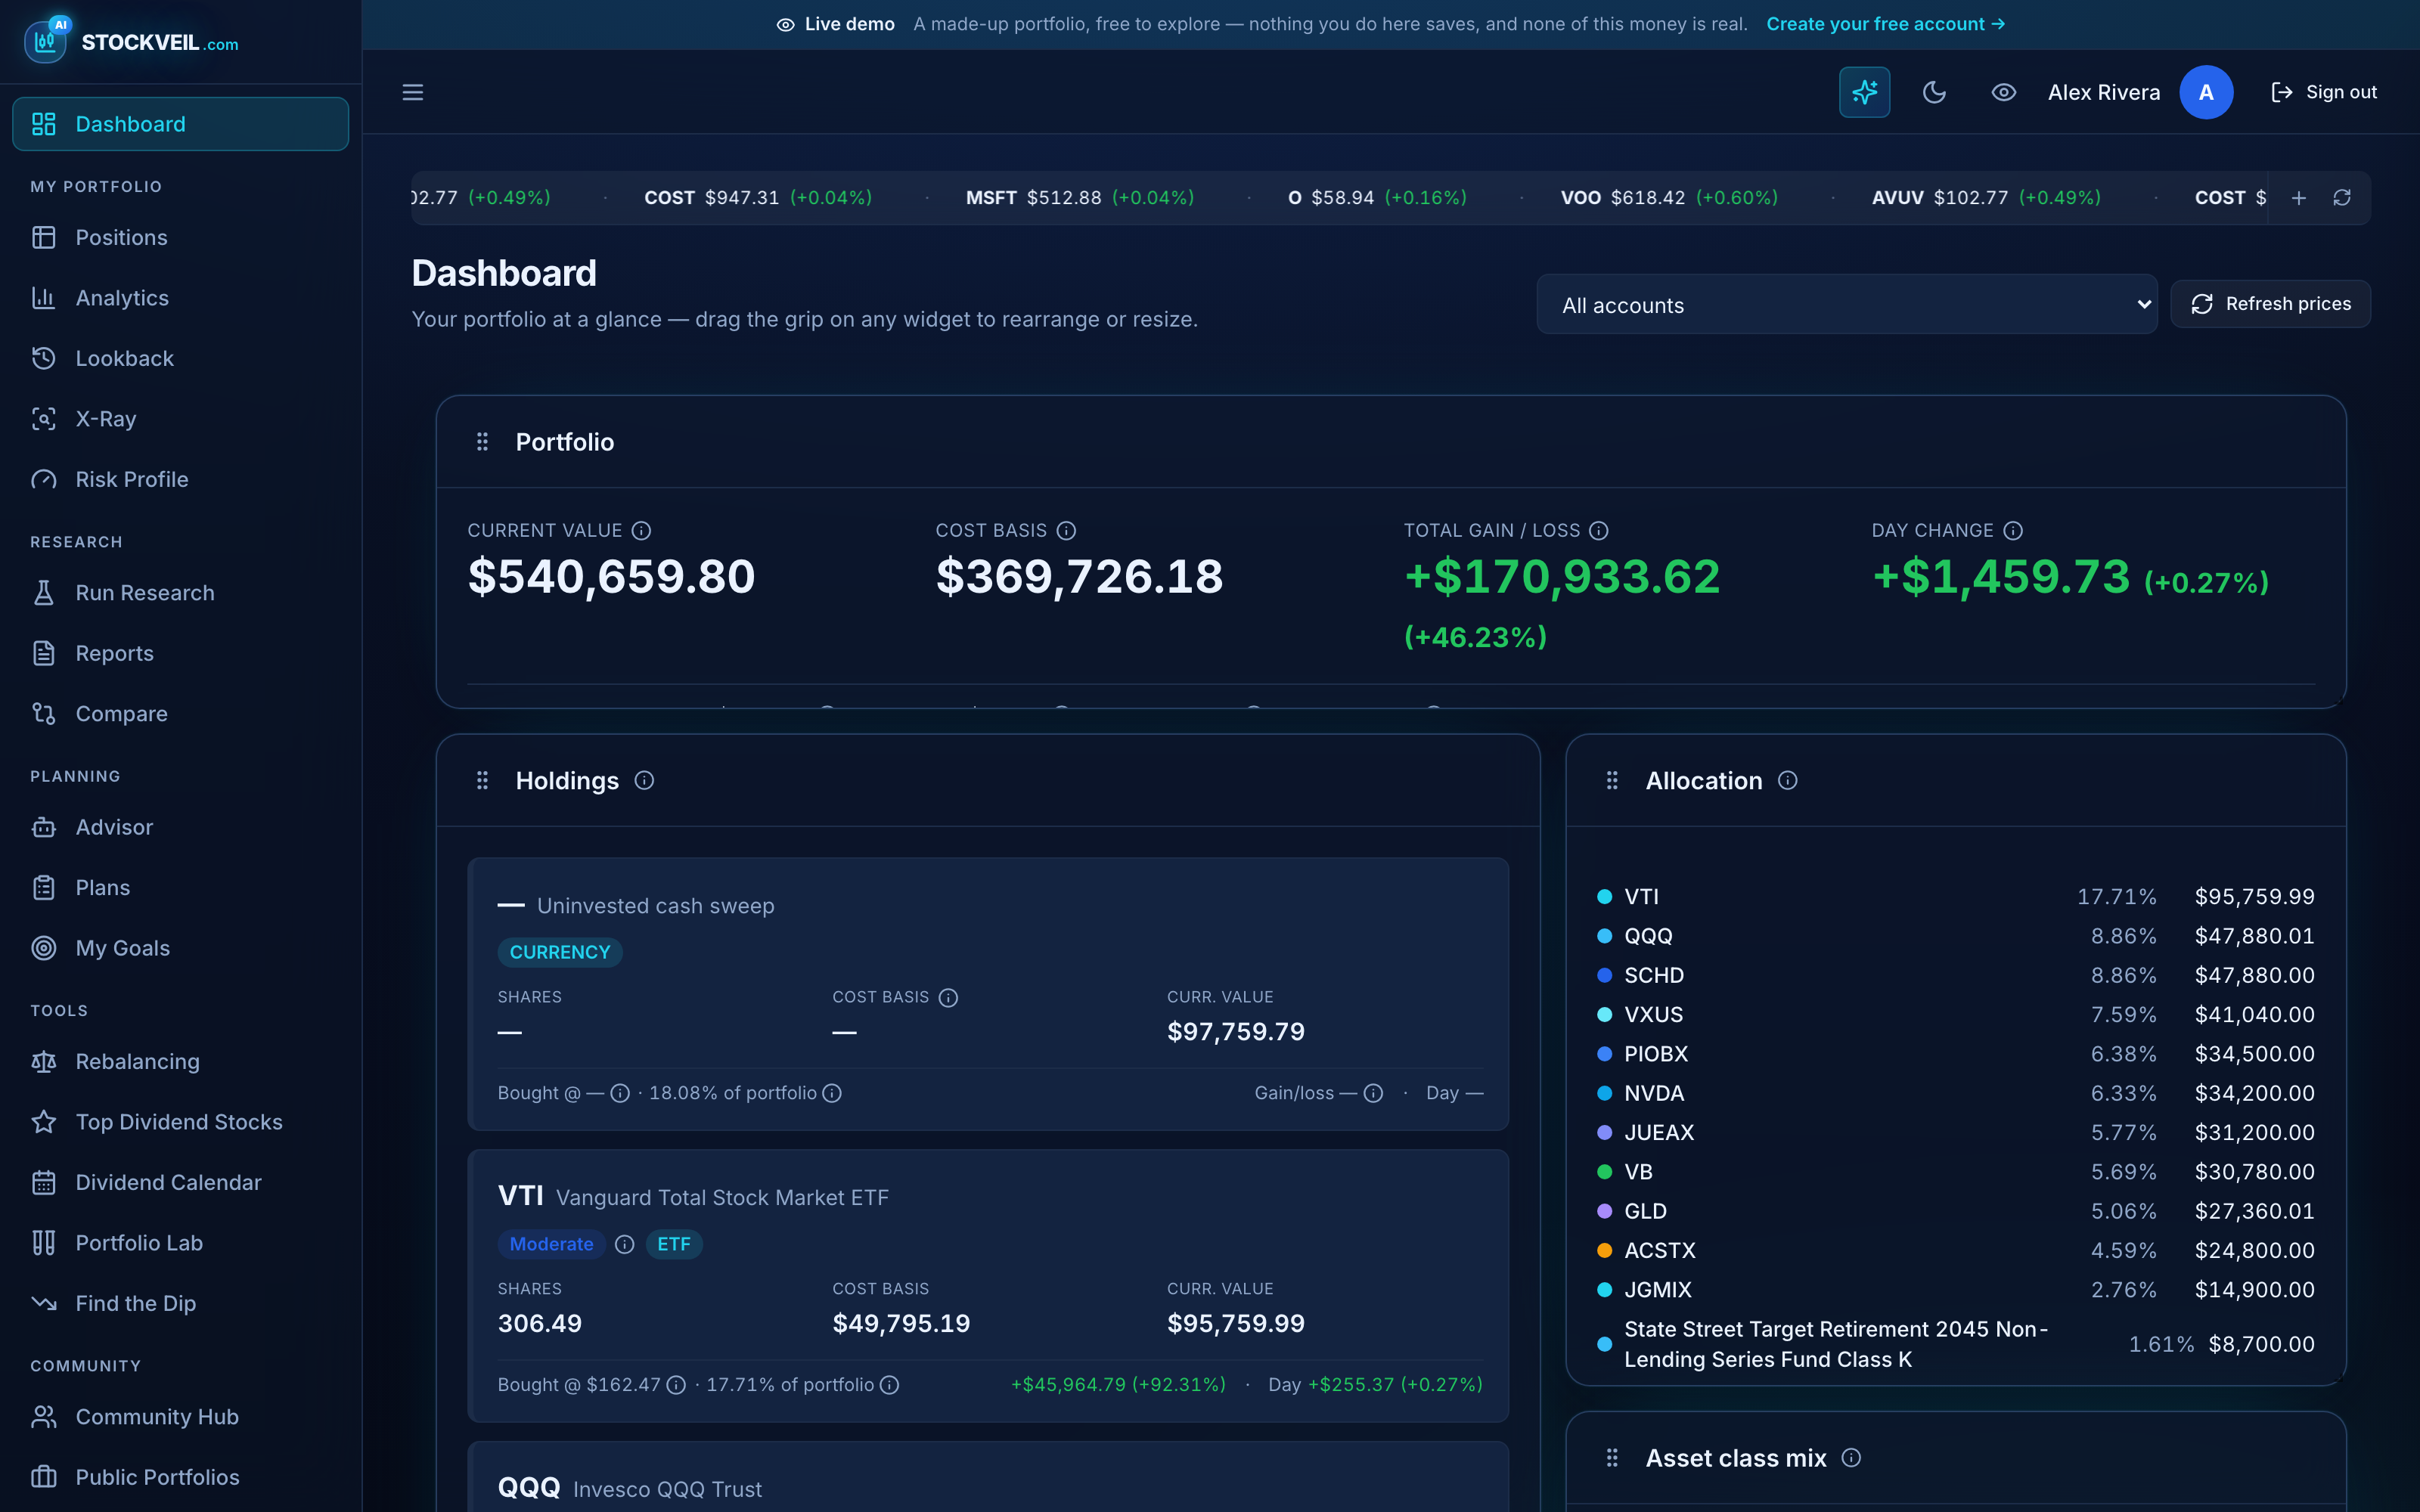
Every account, finally in one place
Brokerage, IRA, 401(k), savings — including the ones no app can sync. One total that is actually your total.
- How do I connect my accounts?
- What about my workplace 401(k)?
- Can I keep portfolios separate?
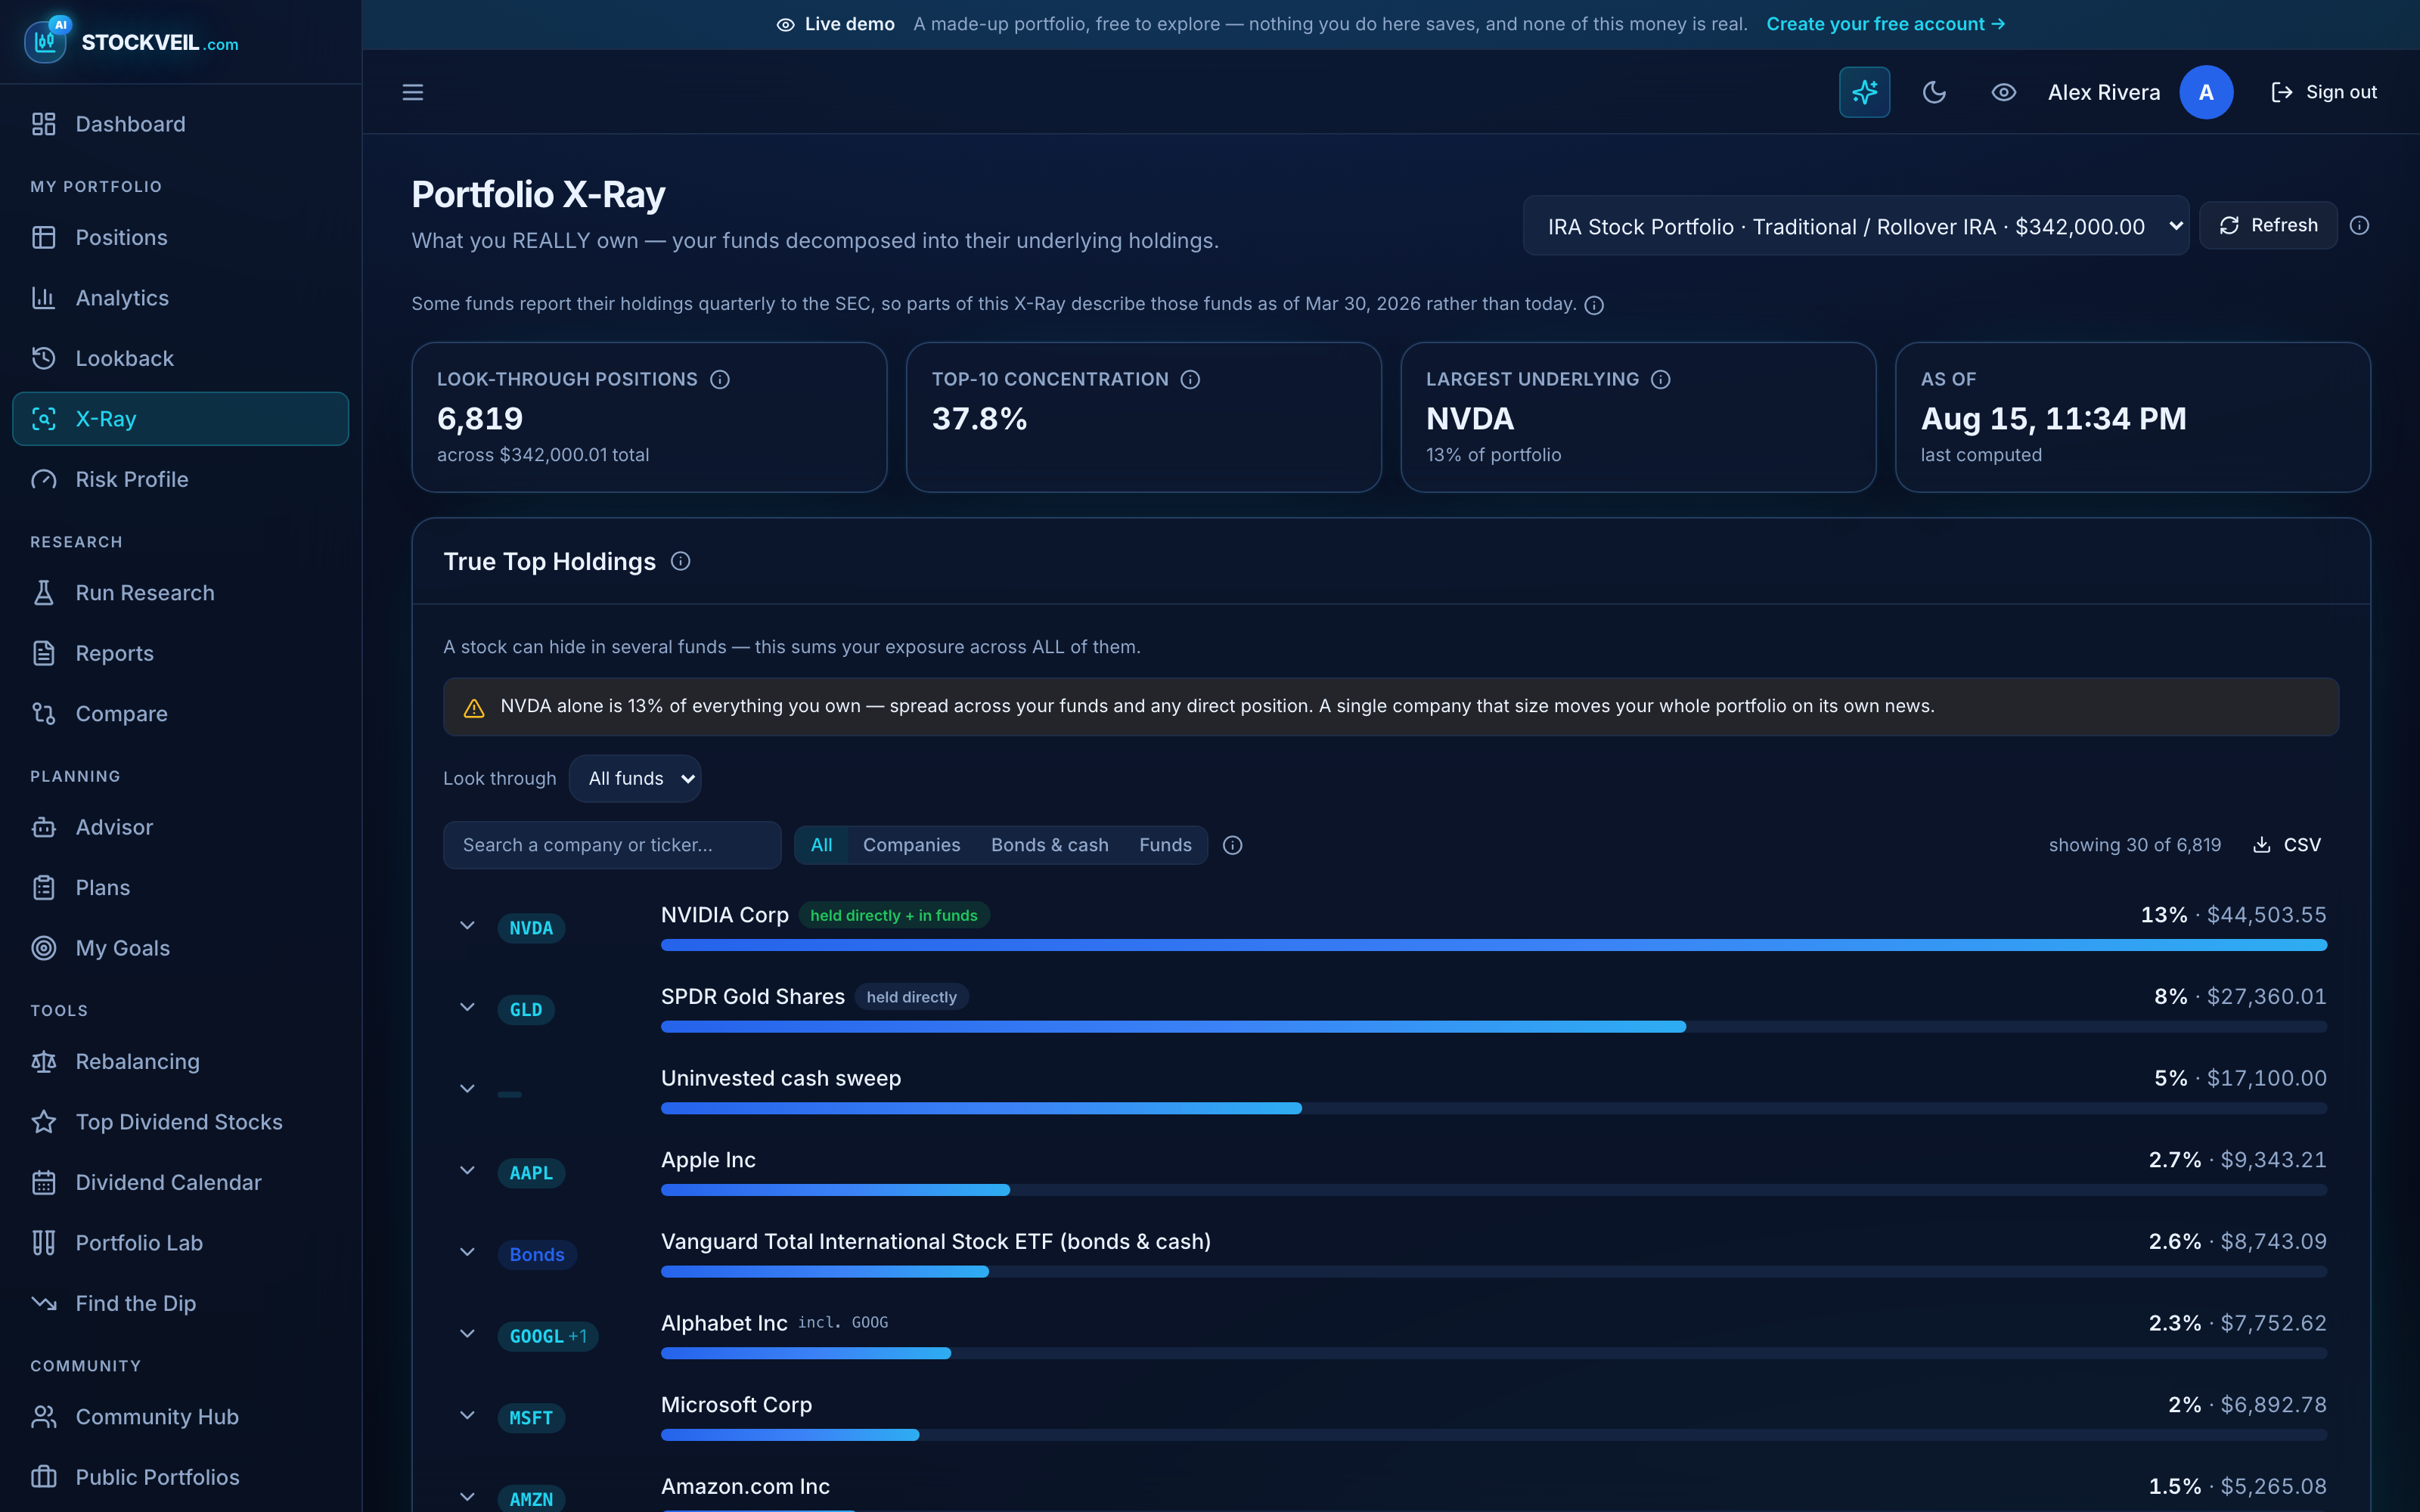
You own more NVIDIA than you think
Three funds, one hidden concentration. The X-Ray unpacks every fund you hold into the companies underneath and adds up what you really own.
- What does the X-Ray actually show?
- Where does the fund data come from?
- How current is it?
Four analysts, one argument, and the receipts
Every report is scored by four opposed investing philosophies, then argued over by a bull and a bear. You bring the AI key; we make sure the numbers are ours.
- What does a research report contain?
- How do you stop the AI making things up?
- Whose AI key does it use?
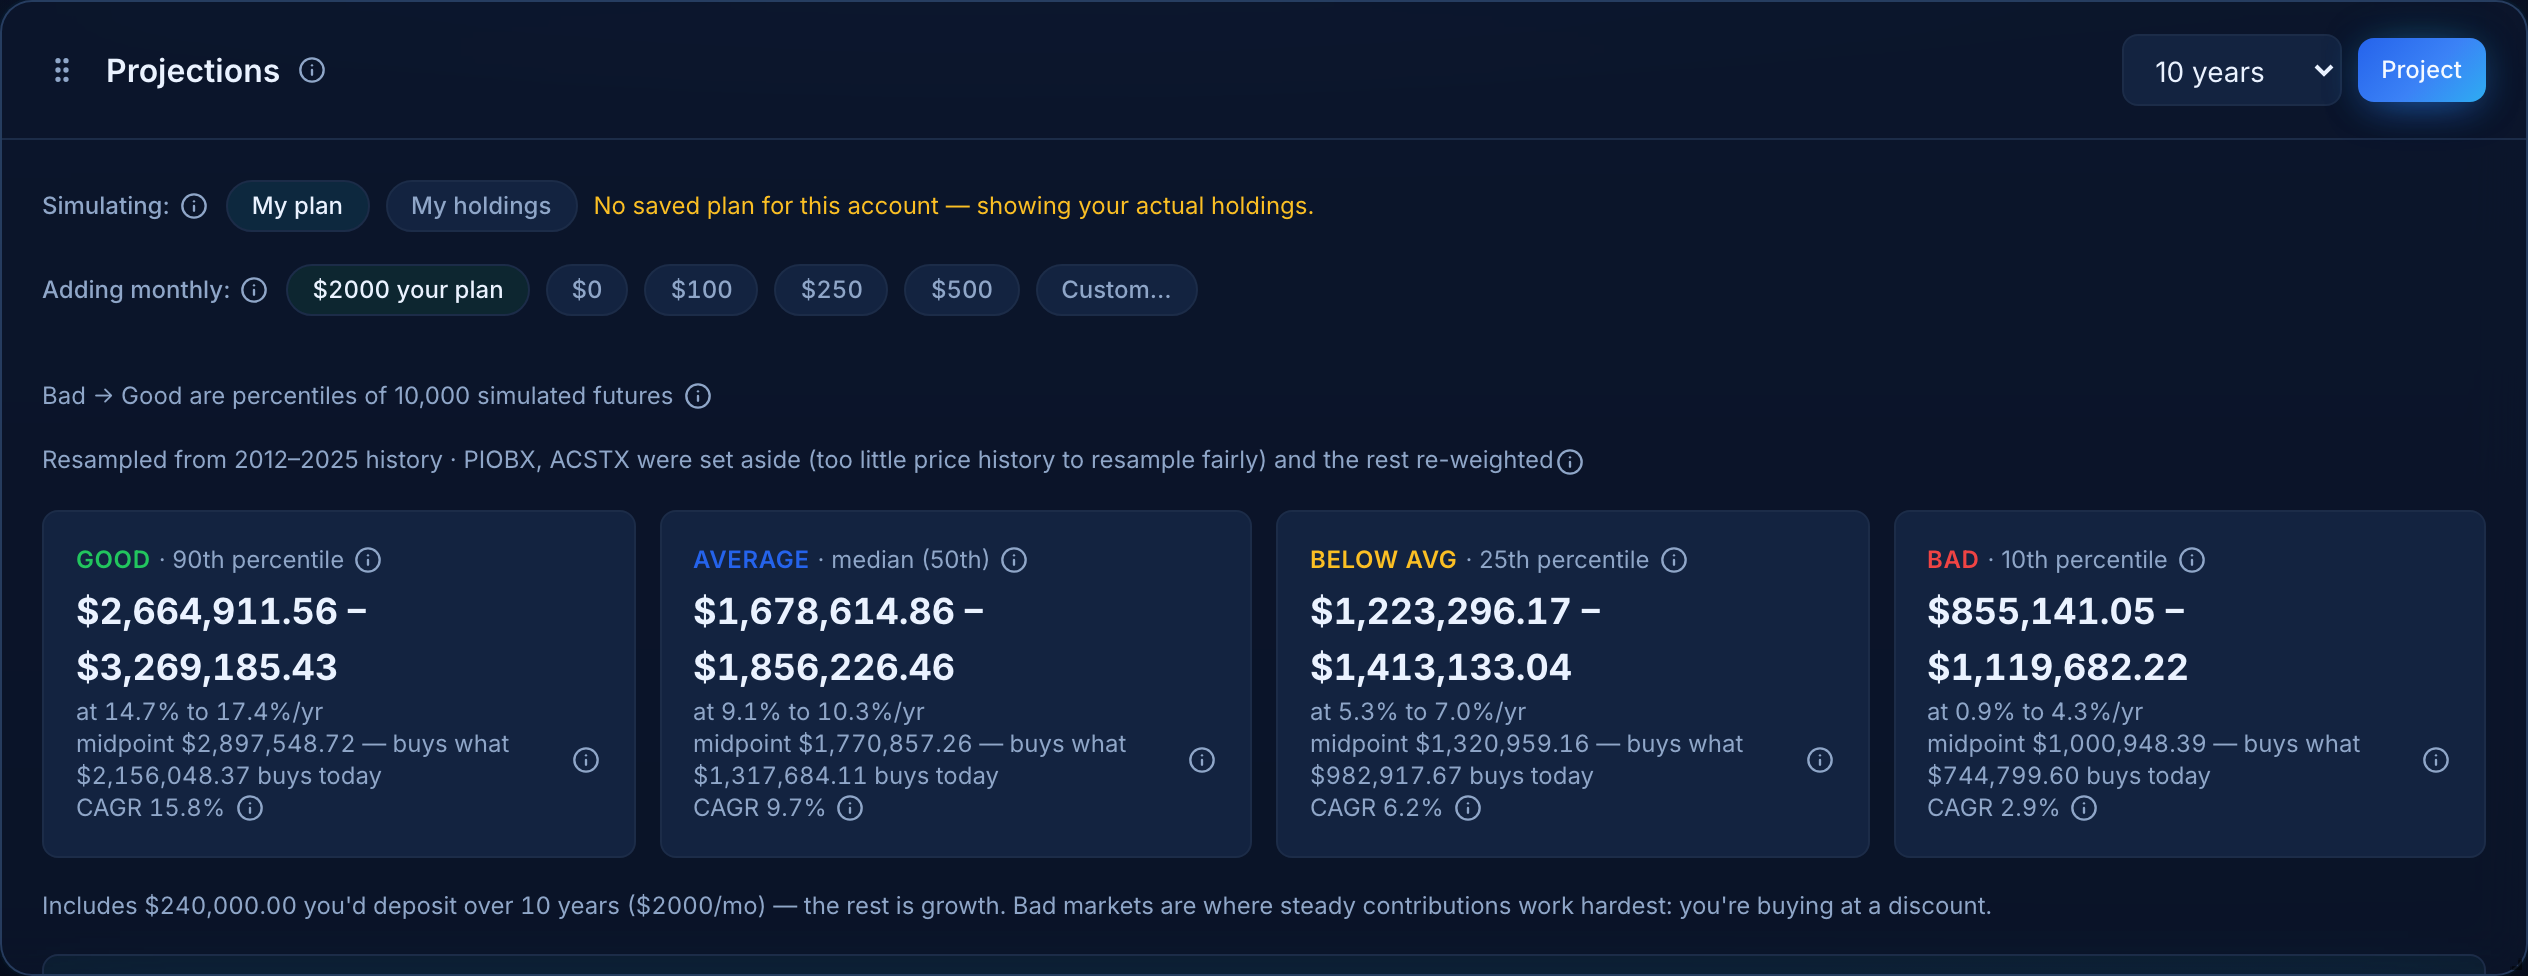
Ten thousand futures, none of them a promise
What your portfolio could be worth in 1 to 30 years, built by replaying real market history — and labelled a simulation, because that is what it is.
- Is this an AI prediction?
- How does the simulation work?
- Why not just use my funds’ own average return?
Decide with numbers, not nerves
Where should this month’s deposit go? Would that allocation have survived 2008? When does the dividend actually land?
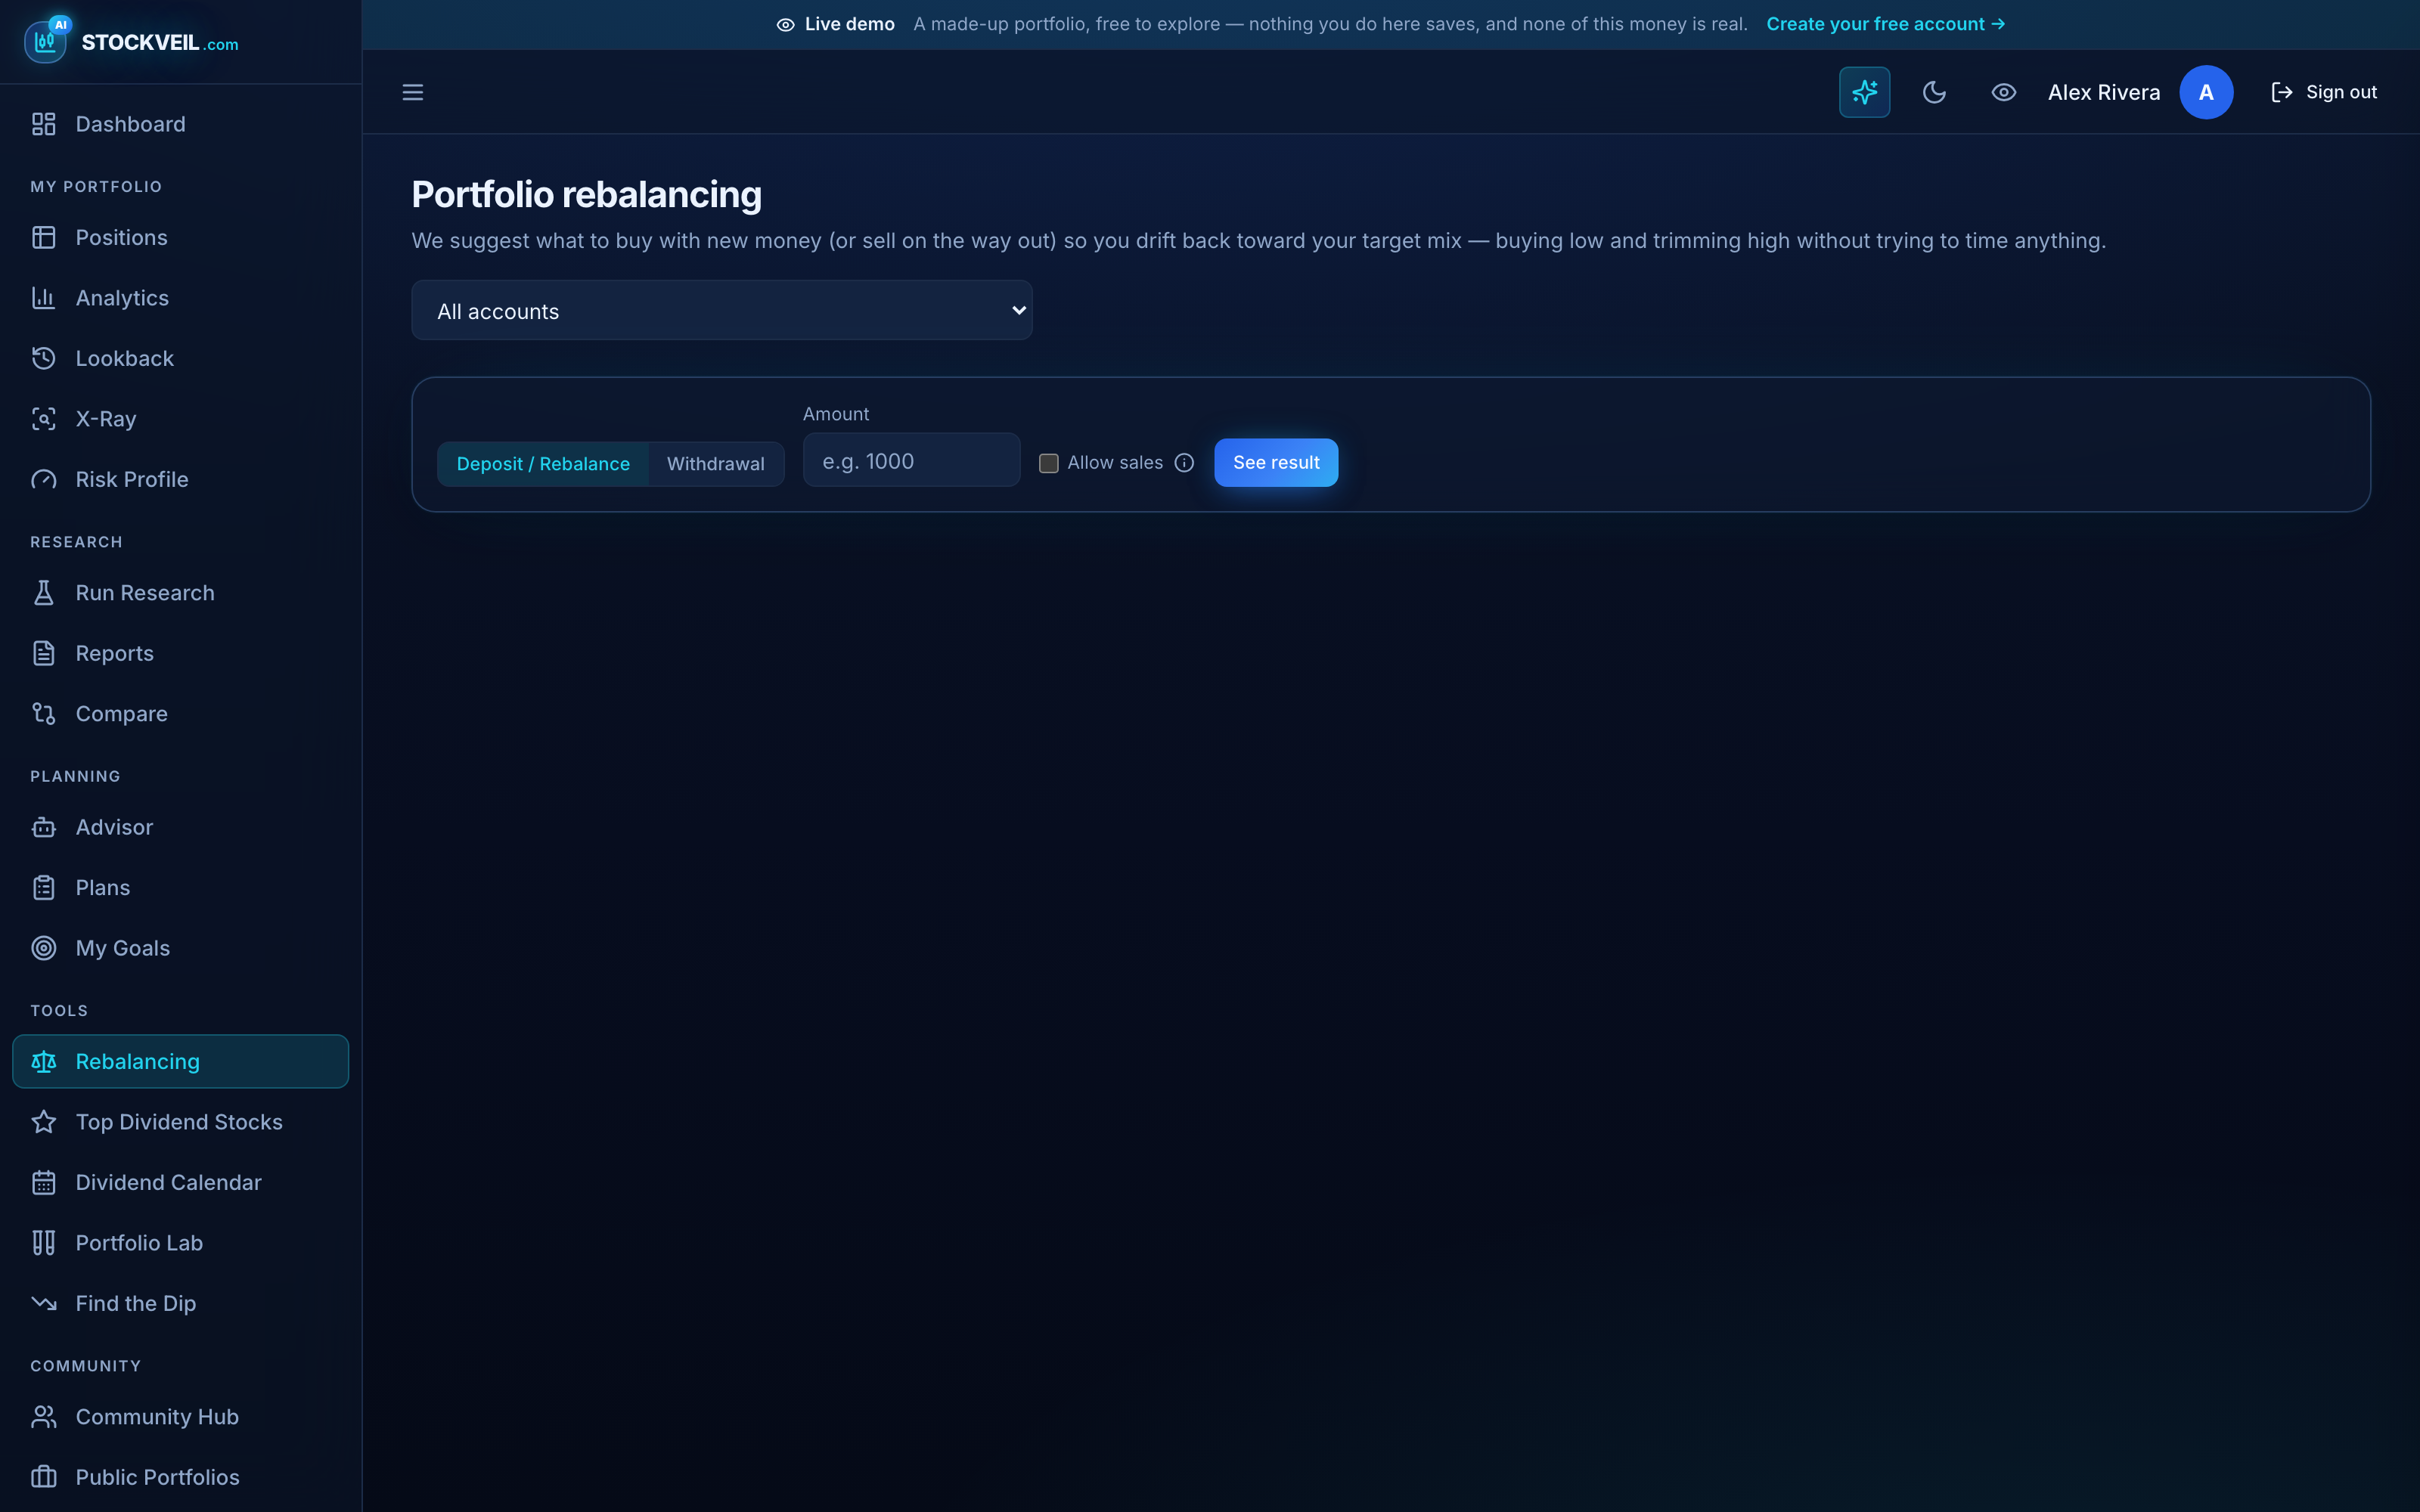
- How does rebalancing work?
- Can I test an allocation before committing?
- What do the dividend tools do?
The parts that are hard to copy
Plenty of trackers show you a pie chart. These are the things we built because nobody else would.
Fund data from the primary source
Look-through comes from the funds’ own SEC filings — the same documents data vendors resell — so it is complete rather than a top-25 sample, and it covers the workplace mutual funds that ETF-only feeds skip.
Your AI key, your spend, no markup
Bring a key from OpenAI, Anthropic or Google. You pay them directly at their prices, you choose the model, and Stockveil estimates the cost of a run before you start it.
AI proposes, deterministic math decides
Research scores are clamped to figures computed from real data, suggested alternatives are validated against the market, and the portfolio grade, drift, X-Ray and fit involve no AI call at all.
The purpose of the money picks the rubric
All cash is the right answer for a house fund and a catastrophic one for a 401(k). Each account carries its own mandate and is graded by it — very few tools make that distinction.
Workplace plans are first-class
Collective investment trusts have a CUSIP and no ticker, so tools that key off tickers silently drop them. Stockveil stores, names and counts them, and reports employer match as dollars a year forfeited.
Honest by construction
Benchmarks receive your actual deposits on your actual dates. Backtest windows are the intersection of every fund’s history. Reconstructed history is labelled approximate rather than drawn as fact.